IB Economics syllabus: Macroeconomics (inflation)
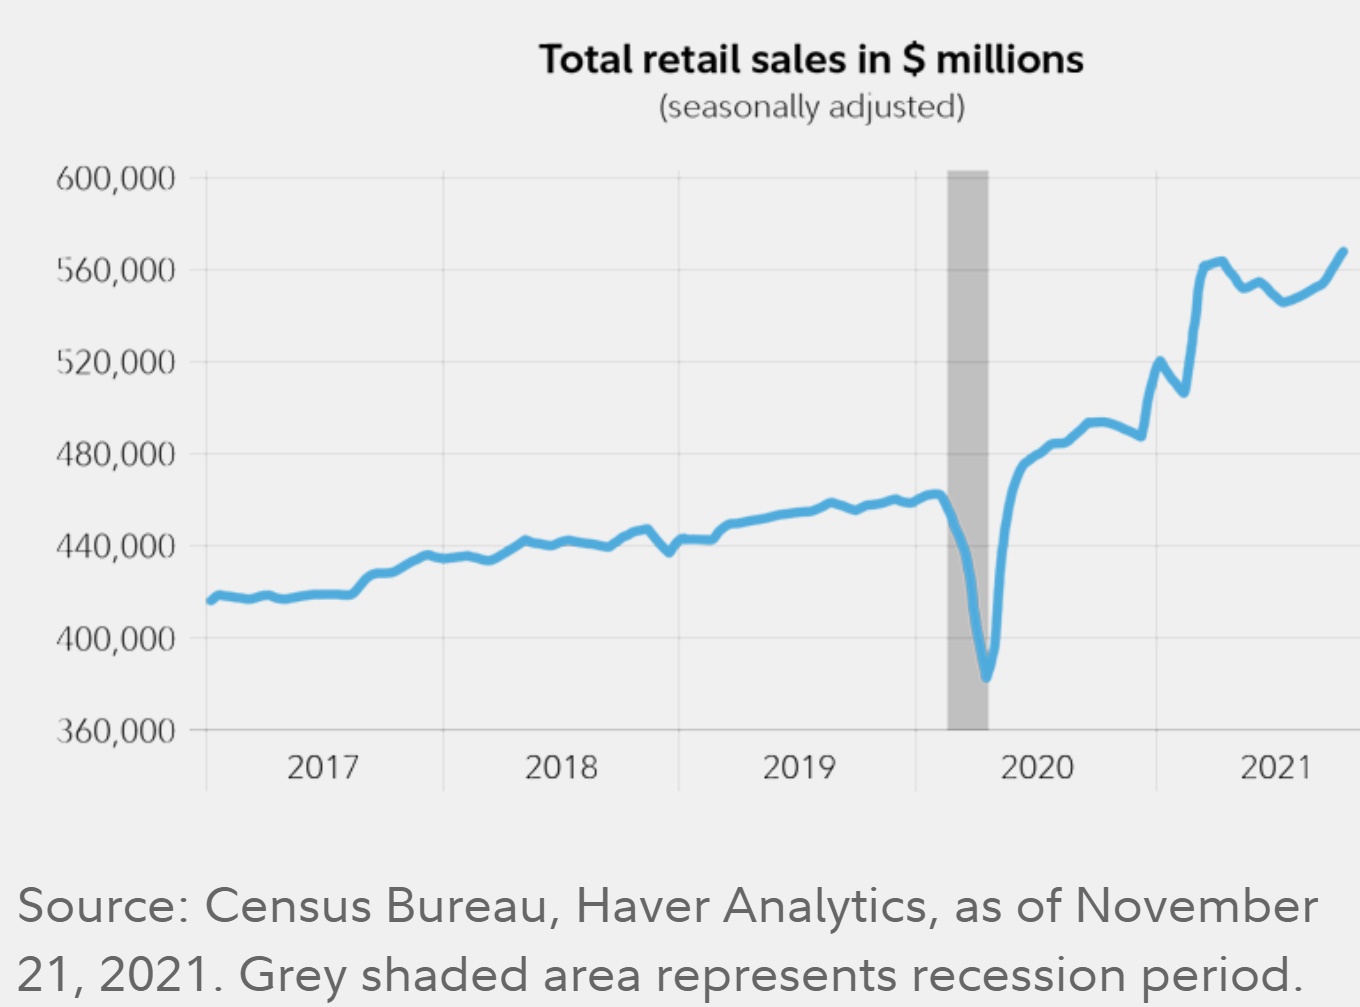
This post is about the graph above. Up till recently, central banks have argued that “inflation is temporary (using the word ‘transitory’), it’s all caused by purchases happening now that were delayed due to the pandemic.” In other words, during lockdowns consumers were not buying goods and services at all, and so now they are making up for it by buying everything that they wanted to earlier but couldn’t. Therefore, everything should get back to normal and inflation will also lower in the near future. At least, this was what they had communicated. But not any more…
Jerome Powell, chairman of the Fed in late November 2021 stated that “It’s probably a good time to retire that word and explain more clearly what we mean.” This means the word ‘transitory’ does no longer apply to the current high inflation in the U.S. and perhaps it’s time to prepare for inflation that lasts. This is exactly what this graph at the top is telling us.
What does the graph show?
If inflation were truly transitory, then the expectation is that current expenditure exceeds the average by as much as it was below average during the lockdowns. In this case, aggregate demand should fall soon, production gets back to where it used to be and we’re back to old prices: high inflation comes to an end.
If, on the other hand, inflation is high now as there was too much money injected into the economy, then what we should see is that the current increase in consumption is much higher than how much it was lower during lockdowns. You guessed right, that’s exactly what this graph shows. If the money supply increases without an accompanying increase in national output (final goods and services produced domestically), and the velocity of money does not change, then inflation will increase. All you gotta do is check the graph to see how retail sales went up in the past two years.
Source of image: Unsplash.com

Do you need a little boost with IB Economics?
Get help from an examiner: check out private lessons.
Looking for more articles?